Keep the bit in the pay zone from anywhere
At GeoWells Consultants, we deliver comprehensive geological services that give oil and gas operators the insight to make confident drilling and production decisions. Our geoscientists bring over 26 years of multinational expertise, including the successful geosteering of some of the world's longest wells, extending up to 53,000 ft MD in thin carbonate reservoirs across the Middle East.
Using advanced LWD density and resistivity imaging, state-of-the-art geosteering software, specialized geo modelling, and post-drilling geological and petrophysical studies, we provide precise, real-time solutions that improve accuracy, efficiency and safety at every stage of exploration and development.
To deliver world-class geological solutions that let oil and gas operators drill smarter, safer and more efficiently, with accurate real-time insight that reduces risk, optimizes reservoir performance and supports sustainable energy development.
To be recognized as a global leader in geological consulting, known for innovation, technical excellence and reliability, advancing geoscience practice, adopting emerging technology and building long-term partnerships that shape the future of exploration and production.
Steering desk
Synthetic model for illustration: 1.0° down-dip, 26 ft target interval, one fault at 1,900 ft VS. Not a field result.
Section view, TVD (ft) against vertical section (ft), with gamma ray below
- Measured depth
- –
- TVD, ft
- –
- Inclination
- –
- Gamma ray, gAPI
- –
- To top / base, ft
- –
- Footage in target
- –
Reading the borehole wall for dip
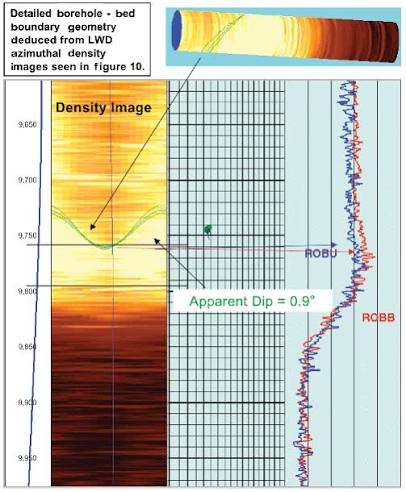
LWD azimuthal density images show the rock on every side of the hole. Picking the bed boundary on the image gives the dip that the steering calls are built on.
-
The image
An unwrapped borehole wall
The left track shows density around the full circumference of the hole, cut open and laid flat. A change in tone is a change in rock. On this scale lighter tones sit above the pick and darker tones below it.
-
The pick
A sinusoid marks the boundary
A flat bed crossing a round hole always unrolls into a sinusoid. The green curve is the boundary fitted to the image. Its amplitude, set against the hole's inclination, gives the apparent dip, 0.9° in this example. The 3D view at the top shows the same plane draped over the hole.
-
The curves
Density from different sides of the hole
The two density curves on the right, labelled ROBU and RCBB, come from different sectors of the hole. They separate when a boundary reaches one side before the other, and which curve moves first shows which way the boundary lies.
-
The result
Dip goes straight into the model
We load the picked dip into the geosteering model, update the section, and steer to keep the well at a set distance from the boundary. The steering desk above shows what happens when that dip changes underneath a drilled well.
Geology from the first model to the end of well report
Comprehensive geological services that give oil and gas operators the insight to make confident drilling and production decisions.
Geo Modelling
2D and 3D reservoir models that integrate seismic, well data and logs to support field development planning and reservoir management.
Well Planning
Vertical, deviated and horizontal well planning, with the right tools for the reservoir to optimize well cost.
Geosteering Horizontal Wells
Advanced directional guidance to maximize reservoir contact, productivity and operational efficiency.
LWD and Wireline Log Interpretation
Petrophysical evaluation of logging data to determine formation properties, fluid contacts, water saturation, reservoir potential and hydrocarbon zones.
Wellsite Geology
Real-time monitoring and analysis of lithology, stratigraphy and hydrocarbon indicators to optimize drilling operations.
Predrill Planning and Post-Drill Documentation
Comprehensive reports, end of well reports, composite logs and post-drilling geological and petrophysical studies, with continuous monitoring of drilling activity and timely recommendations for course corrections.
From the model to the rig floor
The same four stages on every well, so your driller knows what a call looks like before the first one arrives.
Plan and model
We build 2D and 3D models from seismic, well data and logs, plan the well with the right tools for the reservoir, and set the target window and the log signatures to expect at each boundary.
Read every update
Your rig's data feed streams surveys and LWD density and resistivity data, including images, to our geosteering software. We correlate each update to the model and track apparent dip as it changes.
Tell the driller what to do
A call states where the bit sits, how far it is from the top and base of the target, and the inclination to drill next. It goes to the directional driller and the company representative.
Close out the well
End of well report, composite logs, and post-drilling geological and petrophysical studies, with notes that update the model for the next well.
MD 14,820 ft   TVD 10,004.6 ft   INC 89.2°
GR rose from 48 to 112 gAPI over 40 ft. Azimuthal GR reads higher on the up side: exiting through the top.
Apparent dip 1.4° down. 3.1 ft to the top of the target.
CALL Drop to 88.0° over the next 60 ft, then hold 88.6° to run parallel to the bed.
What we need from the rig
- A live data feed, WITSML or WITS
- LWD density and resistivity, with imaging where available
- Surveys sent as they are taken
- A phone or chat line to the directional driller
What you get
- Real-time steering recommendations
- Timely course corrections as the model updates
- End of well report and composite logs
- Post-drilling geological and petrophysical studies
Every channel that places the bit
No single curve steers a well. We combine them so an exit through the top is not mistaken for an exit through the base.
| Channel | Unit | What it tells us |
|---|---|---|
| Gamma ray | gAPI | Separates shale from clean rock. A hot marker above the target shows when the bit has risen out of it. |
| Azimuthal density images | g/cc | Show the rock around the hole, giving dip and which side meets a boundary first. See the example above. |
| Resistivity, shallow and deep | ohm·m | Shows boundaries before the bit reaches them and changes in fluid within the bed. |
| Density and neutron | g/cc, v/v | Confirms lithology and porosity where the tool is in the string. |
| Mud gas | units | Backs up the log picture with gas shows while drilling. |
| Surveys | ft, deg, deg/100 ft | Measured depth, inclination, azimuth and dogleg that place every reading on the section. |
What we hold ourselves to
By integrating cutting-edge technology with deep industry knowledge, we help clients achieve operational excellence, minimize uncertainty and unlock the full potential of their reservoirs.
Integrity
The highest ethical standards, with transparency and trust in every project.
Innovation
Advanced technologies and methods that deliver cutting-edge solutions.
Safety
Safe operations that protect people, assets and the environment.
Excellence
Precision, quality and continuous improvement in every service.
Client Partnership
Long-term relationships built on understanding client needs and tailoring solutions.
Tell us about the well
Fill in what you know. The summary on the right updates as you type. Copy it and send it to the address below, and we reply with a coverage plan for the first well.